How the prediction works
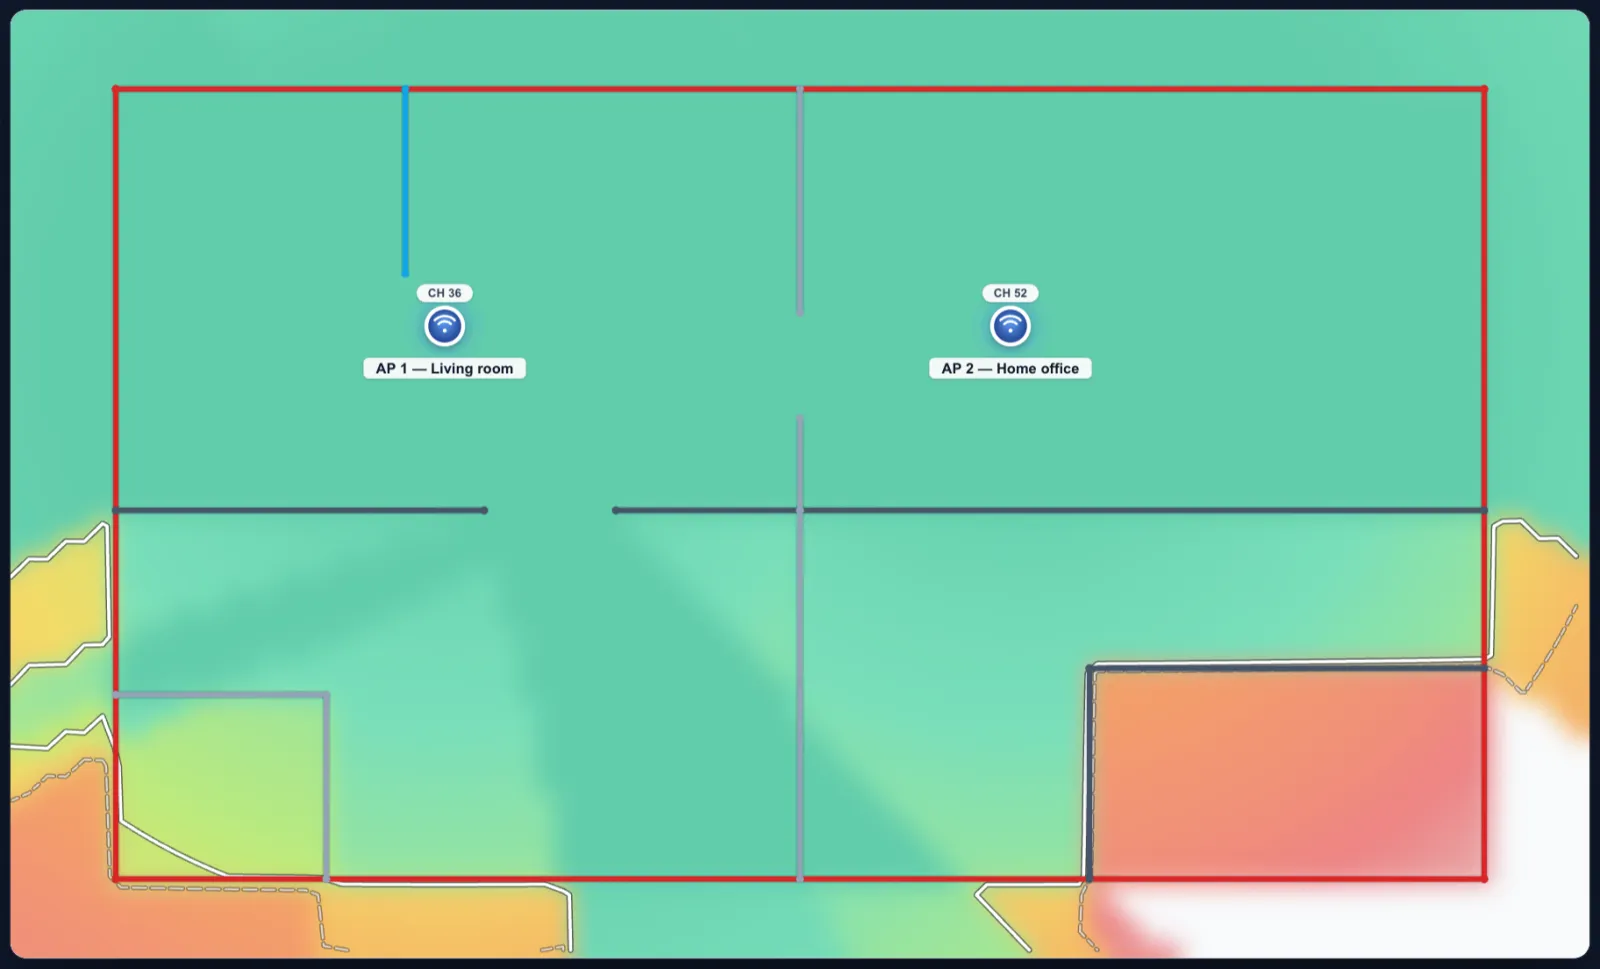
A predictive heatmap computed from physics, in your browser: for every point on the floor, the signal from every access point, minus what the walls, floors and furniture take on the way. Then the strongest one wins, as it does for a real client.
The model
The engine is the COST-231 multi-wall model, the approach commercial planners use at their entry tier. For each point it draws a straight line to each access point and adds up:
- Free-space loss for the distance at the band’s frequency: 20·log₁₀(d) + 20·log₁₀(f) − 27.55.
- Furniture and people for the floor’s environment, as a loss over distance (below).
- Every wall crossed, at that material’s loss for that band (the material table).
- Every floor slab crossed, for access points on other floors, using the real 3D distance.
Received signal = transmit power + antenna gain − path loss, capped at −25 dBm because no real radio reads better. A wall-mounted access point also loses signal behind it (mounts).
Worked example
The editor’s default radio (20 dBm, 3 dBi) on 5 GHz, a laptop 8 m away in a furnished home, through one brick wall: 20 + 3 − 65.3 (free space) − 3.1 (furniture) − 11 (brick) = -56.4 dBm. That is excellent signal.
What the colours mean
| Signal | dBm | In practice |
|---|---|---|
| Excellent | ≥ −65 | Anything works, including video calls on the move |
| Good | −75 to −65 | Browsing and streaming |
| Marginal | −85 to −75 | Connects, but slow and fragile |
| Poor | below −85 | Drops out |
The coverage percentage counts the floor at or above -67 dBm, the usual design line for voice and video, drawn on the map as a contour. Four layers read the same field: Signal, Channel overlap (where your own access points share a channel), Link rate (an estimated PHY rate from signal alone) and Serving AP (which access point each spot uses).
Furniture and people: the environment
Wall losses are physical material figures, so furniture sits in neither term. The environment puts it back as a loss over distance, the IEEE 802.11n/ax indoor law: free space to a breakpoint, then 35 dB per tenfold distance. Excess loss at 20 m from the access point:
| Environment | Law | at 20 m | Source |
|---|---|---|---|
| Office (furnished) | free space to 10 m from an access point, then 35 dB per tenfold distance | 4.5 dB | IEEE 802.11ax enterprise model, 802.11n model D |
| Dense | free space to 5 m from an access point, then 35 dB per tenfold distance | 9.0 dB | IEEE 802.11n model C, small office |
| Home | free space to 5 m from an access point, then 35 dB per tenfold distance | 9.0 dB | IEEE 802.11ax residential model, 802.11n model B |
| Open hall | free space to 20 m from an access point, then 35 dB per tenfold distance | 0.0 dB | IEEE 802.11n model E, large open space |
| Walls only | free space between the walls, no extra loss | 0.0 dB | free space between the walls |
Floors
With more than one floor Pro, an access point lights up the floors above and below through each slab it crosses:
| Slab | 2.4 GHz | 5 GHz | 6 GHz |
|---|---|---|---|
| Wood joist | 5 dB | 7 dB | 8 dB |
| Concrete | 18 dB | 23 dB | 26 dB |
| Reinforced concrete | 25 dB | 32 dB | 35 dB |
| Steel deck | 32 dB | 38 dB | 42 dB |
Accuracy, and what is not modelled
Expect ±6 to 10 dB against a measurement in a typical home or small office: enough to decide the access point count and placement, not a replacement for a check after installation. Not modelled: interference and noise (so no SNR), multipath and reflections, 3D antenna patterns beyond a wall mount’s front-to-back loss, and calibration against measurements. Every figure and source: Accuracy, in full.